Showing posts with label Economics. Show all posts

Monday, December 30, 2019

Illinois tax increase will benefit FIVE states that voted for Donald Trump


Liberals are bad at math everywhere, but starting January 1, 2020 the liberals running the state of Illinois will begin learning math the hard way. As an added irony, all five of the states that will benefit most from Pritz's folly are states that voted for President Donald Trump.

The New Year marks the effective date for a slew of new tax increases, passed by the Democrat-controlled legislature during their Spring 2019 money grab. These included a new gas tax, a new tobacco tax and 18 other "ways and means" signed into law by Governor J.B. Pritzker.

One of the most onerous measures is a trade-in tax, which will be applied to the value of a car with a trade-in value over $10,000.
The trade-in tax is particularly bad tax policy and cannot be justified as anything other than a revenue grab. The money isn’t even targeted to roads.

The state currently collects no sales tax on a car’s trade-in value, which acted as credit toward a new vehicle purchase. The sales tax only applies to the difference between trade-in value and the new vehicle’s purchase price, preventing residents from having to pay sales tax first when a vehicle was purchased new and then a second time when it was traded in. After Jan. 1 that trade-in vehicle will be taxed twice.

Any trade-in value above $10,000 will be subject to the full state and local sales tax burden, which is highest in Chicago at 10.25%. The tax is expected to cost Illinoisans $60 million. The state’s auto dealers are rightly upset about the dampening effect this is likely to have on car sales and have called foul on the double taxation aspect.

If you trade in a car valued at $20,000 before Dec. 30 to purchase a $35,000 vehicle, you will pay $1,311 in sales tax, which was only on the value of the new car above the trade-in value. But that exact same transaction will cost you $2,185 after Jan. 1.
You paid sales taxes when you first bought the vehicle. You pay the state the license and registration fee. You pay sales taxes on the new car and now you have the honor and privilege to pay taxes on the trade, to.

Auto dealerships in  Iowa, Michigan, Indiana, Kentucky and Missouri are cackling in delight. There is no stopping a car owner in lovely Mt.Vernon from driving an hour or so to St. Louis or Evanston to trade in their well-maintained Toyota Tundra and buy a new one. Who wouldn't spend a couple of hours to save a few grand? Now think of car owners in Chicago, who have options in South Bend, Gary, Racine and Kenosha.

Automobiles are your property. Once it's paid for, you can sell your property in any state in the union (or overseas, if you want). What you do with that money is your own business. You can put it down on a newer model. You can bank it for something else and sign a zero-down lease.

Automobile sales will be very hard hit in Illinois while sales in her sister states will benefit from a yuuge uptick in volume. You can't have used car sales without used car supply and St. Louis and South Bend is about to be swimming in a sea of inventory, all compliments of Pritz and his ill-schooled liberal friends in Springfield.

Thursday, November 14, 2019

The world's second oldest profession is making a comeback in the Gulf of Mexico


About 3,500 years ago, a bunch of sea-faring ne'er-do-wells decided they'd give up fishing, hoist the black flag and start raiding the commerce of the ancient Greeks and Phoenicians. After centuries of determined attempts to put an end to the swashbuckling violence of piracy at sea, the marine thievery has never been completely eliminated.

I've always wanted to use this quote in a blog post:
"Every normal man must be tempted, at times, to spit upon his hands, hoist the black flag, and begin slitting throats." -- H.L. Mencken 

Troubling news reports like this one are becoming more common (again) right in America's backyard:
Pirates attacked an Italy-flagged offshore supply vessel in the southern Gulf of Mexico, injuring two crew members, the Mexican Navy said on Tuesday, in the latest outbreak of robbery and piracy to hit oil platforms and infrastructure in the area. ...

Mexican state oil firm Pemex has said robbery is increasingly affecting its oil infrastructure. Sophisticated equipment has been stolen and resold, and crews robbed.

Most registered attacks have been in the southern rim of the Gulf of Mexico, where dozens of oil platforms produce thousands of barrels of crude per day.
Piracy and theft have been a way of life in the Gulf of Mexico and the Caribbean Sea almost since Europeans began colonizing the tropical land masses in the early 16 century. Suppression of piracy has been one of the principal duties of the navies of every empire or nation with commerce in the region. Right up until the early 19th century, pirates were to be summarily hanged without trial and their tarred bodies preserved and displayed at the entrances of harbors throughout the Gulf, Caribbean and well up the Atlantic coast.

High seas piracy in the modern era has been correlated with proximity to failed states. Witness the scourge of piracy in the waters off Somalia, the Gulf of Guinea and Strait of Malacca. Each of these world regions has been beset with political and economic turmoil, resulting in widespread poverty and inevitable crime. Is our southern neighbor Mexico teetering on a brink of state stability? Hmm...
“Although oil and diesel stealing has been going on for decades, there has been an increase in criminal activity reported in the last four years,” Johan Obdola, founder of the Global Organization for Security and Intelligence, told Fox News. “It is estimated that the stealing in Mexico is up to 1.18 million barrels a day, bringing millions to criminal organizations, and making it very difficult to control.”

And, controlling the matter is convoluted by the notion that little is known about the exact network of pirates who are believed to have been born out of local fisherman circles. Even corrupt government workers themselves have aided some of the piracy, experts have asserted.

Since he took office in December 2018, President Andrés Manuel López Obrador vowed to make oil theft a top national-security priority. This past January, officials shut down several Mexican Petroleum (Pemex) pipelines in an attempt to curb the smuggling and piracy, but the shortage triggered a schism among the oil-hungry cartels and a national deficit that angered people across that country.
The criminal cartels in Mexico and Central America have diversified since the 1980's. Drug smuggling is lucrative, but so is human trafficking and now, apparently, so is piracy. Warlords in Africa and cartel bosses in the Americas exist because the governments in these areas have failed to protect an economic system that produces widespread growth in the wealth of the average citizen.

Does Venezuela come to mind?
In happier times, ferries used to bring groups of Venezuelan tourists to party in Trinidad. Today, though, as Venezuela slides further into all-out economic collapse, its impoverished coastal ports have become modern Hispaniolas - havens for buccaneers.

Most of the pirates are ex-fishermen, who used to make a good living catching tuna, octopus and shrimp in the Caribbean's warm waters. But under Venezuela's former president, Hugo Chavez, the fishing industry underwent a well-intentioned but disastrous nationalisation programme, prompting companies to relocate abroad.

With the added blow of hyperinflation, many of the fishermen now have no job and no way to feed their families. They do however have access to boats and to guns, which are in ready supply on Venezuela's increasingly lawless streets.

It's sadly reminiscent of the piracy crisis in Somalia a decade ago, where jobless fishermen took up arms to prey on passing ships. But while the Somali pirates targeted wealthy cargo ships, the Venezuelans tend to go for fellow fishermen from Trinidad, who aren't much richer than they are.
If there's an authoritarian government ruling a nation with a large coastline these days, there's probably a rampant crime problem and crime doesn't stop at the shoreline.

Piracy hasn't been a serious problem in the Northern Gulf or along the eastern coast of the U.S. since about the late 18th century. Gee... what happened in the area about that time?

Monday, November 11, 2019

Nobel Laureate Milton Friedman on the Phil Donahue show in 1979


This is a clip from one of Dr. Milton Friedman's appearances on Phil Donahue's show. Friedman was a Nobel Laureate in Economics and the founder of modern Monetarism.

This video is cross-posted on IBCR's Facebook Page.


Not one single Democrat in Congress or running for President in 2020 can accept what's being taught in this 3:00 segment.

Not many Republicans can either, but which side do you think is more likely to follow an economic philosophy of unleashed personal economic liberty?

Here's the full episode of Donahue.


An American 'wealth tax' would produce a global economic catastrophe


Wealth.  An abundance of valuable material possessions or resources. Property or other material possessions with a monetary value, such as livestock, capital stock, jewelry and precious metals. Money, or things that can be exchanged for money.

In any exchange economy, wealth is a measure of our ability to produce. You cannot give unless you first have. You cannot earn unless you produce. If you produce less, you earn less. If you have more, you can pay more to those who earn by producing more.

The more of anything you have, the less each discrete unit of it is worth. The scarcer something is, the more it's worth. If a scarce something is highly desirable, competition by those desiring it will drive the price up.

There is an immutable truth in basic economics: If you tax something, you will have less of it. We also want to be paid the most the market will bear for whatever we sell while paying the least the market will bear for whatever goods or services we buy. We are an altruistic society but we each act in our own self interest.

The wealthiest Americans are not just sitting on big fat bank balances. No one who hoards wealth holds it for long. Microsoft founder Bill Gates, worth an estimated $108 billion is not just hoarding cash and cash equivalent assets. Most of his wealth consists of stock in his company, Microsoft. He also holds debt in the form of bonds and Treasury securities, real estate, shares in the ownership of capital assets and other valuable items that are not money. Their value is estimated based on what they could be sold for if he liquidated them today.

There are about 750 other American billionaires, and many other billionaires from other countries who hold American assets or who are deeply involved in the U.S. economy. All of those are just like Gates.

Microsoft is a publicly traded company. Anyone can own a part of Microsoft by buying shares of the company's common stock. If you have a 401(k) or some other retirement account that is managed for you by a bank (or some other financial institution), you probably already own some Microsoft stock.

Microsoft stock sells for about $146 (11/12/19) per share. Multiply the total number of shares available by the share price and you get an estimate of what Microsoft the company is worth today. The share price is roughly equal to the expected future net after tax earnings of the company plus any value of capital stock on hand divided by the number of shares. Its price is also subject to the daily fluctuations in the stock market. These fluctuations reflect a dynamic view of investors about the health of the company and its ability to earn money in the future.

A lot of things can affect a company's outlook, including the policies of the governments of the countries it sells its products in and the policies of the country it calls home.

If the U.S. imposed a 6% wealth tax (as proposed by Elizabeth Warren), it will do so to pay for a plethora of new services, including government-funded healthcare, college tuition and student loan debt, universal child care and other "free" stuff.

Those subjected to the tax must raise the funds to pay it because not even Bill Gates keeps $6-$7 billion in checking. Since they would have to convert some of their non-monetary holdings into cash, they'd have to sell them. Selling them would quickly create a large increase in the supply of those and similar assets. When everyone is selling and there are only so many buyers, the prices of the things being sold will begin to fall.

If the average net worth of American billionaires is $50 billion and there are 750 of them, their collective tax burden would increase by 750 x 0.06 x $50 billion = $2.25 trillion, or about the total net worth of about three dozen billionaires.

Some billionaires like Donald Trump are wealthy because of the value of their real estate holdings. Real estate is the most difficult to convert to cash, so selling when they're not ready means selling for less than they could fetch when buyer and seller are both ready to deal. Others, like Jim Walton and the Wal-Mart folks hold real estate and large amounts of capital equipment that are also difficult to sell in less than a year. Bill Gates and almost all other billionaires are also heavily invested in overseas markets or multi-national interests where Americans partner with Mexican, Canadian, Japanese and European concerns. A great deal of planning will go into deciding what to sell, when to sell it and how much to sell it for. This would change how they value their holdings, too. What's worth $100 million today may only fetch $80 million next year.

Billionaires would not be the only people affected by a wealth tax. multi-millionaires and regular millionaires would also be affected. While there are only 50,000 to 100,000 "wealthy" households, even the upper-middle, middle and lower-income classes would be affected because the price of everything will fall.

Bill Gates may be worth $108 billion today, but by the time he and other wealthy Americans sold possessions to pay their taxes, Microsoft stock would not be trading at $146 a share.

How low could Microsoft go? Well, the company is traded on the New York Stock Exchange. A sudden influx of shares for sale in one company would affect the value of the exchange indices that include it. The Dow Jones Industrial Index is one. The Standard & Poor's 500 Index is another. As those indices trade down, the shares of other companies not in the indices would fall too. Why? With a good company like Microsoft selling lower, shares of good companies like Apple, Google and Intel would be sold so that your 401(k) manager can maintain his index-required Microsoft-Apple-Google-Intel ratio. They also trade lower because savvy investors don't buy market-value shares when there are perceived below-market shares available.

Banks, insurance companies, pension funds, large investors and speculators all become affected, making buying and selling decisions that wouldn't have been made before the tax was imposed. Companies are inherently less profitable in higher tax environments, so companies might close offices and factories and lay off workers. With fewer offices, factories and workers there is less income because there's less production. Everything slows down.

Remember, stock prices are a reflection of expected future after tax earnings. Those earnings will be expected to fall, further pressing share values down. We are in a global economy. Many overseas interests are invested in the U.S.economy and any slowdown here always spreads. As the old saying goes, "when the U.S. economy sneezes, the world catches a cold." So a sell-off on Wall Street will trigger sell-offs in London, Paris, Moscow, Sydney, Seoul, Hong Kong and Tokyo.

Keep in mind also that at least $2.25 trillion in assets are being sold into this marketplace. Hundreds of billions and likely trillions more will also be on offer at falling prices. Despite the meticulous planning, such a large influx of assets for sale will create considerable uncertainty. Financial markets flee uncertainty and fly to safety. The safest ports in uncertain times are gold and the debt denominated in the currency of stable sovereign nations. Interest rates will fall, but with the productivity of capital uncertain, economic activity will slow. 

As this cycle repeats itself, Microsoft might be trading so low that Bill Gates is only worth $54 billion. Instead of paying $6-$7 billion in wealth taxes, he's only due to pay maybe $3 billion. Some wealthy households are sure to see their net worth fall to a level where they're no longer subjected to the wealth tax. In fact, the very wealthy will find ways to reduce the value of assets without affecting their true worth.

After what will surely be a short time, government will not have the source of revenue they'd planned on when they promised that plethora of services, especially universal healthcare. Their costs will never go down--they always go up. Then what? Increase taxes? Start the cycle again?

An American wealth tax would result in an unmitigated global catastrophe. Nations that were stable before the tax would likely destabilize. Most at risk would be those who only recently transitioned from developing economies into developed economies. Eastern European and Balkan nations could be cast into deep recessions. South American democracies could devolve into authoritarian states. Resource wars would become more likely.

It may not look exactly this way, but something like this is inevitable.

As former U.K. Prime Minister Margaret Thatcher famously said, "The trouble with Socialism is that eventually you run out of other people's money." It is absolutely true. In every country that has tried it, only misery and human suffering have followed. You cannot tax a people or a nation into prosperity. It has been tried and it has never failed to fail.


Wednesday, October 23, 2019

Seattle's 'Upscale Homeless' dump million gallons of raw sewage per year


It's hard to wrap a mind around this. Is the homeless problem on the Left Coast getting better, or worse? The pour souls in L.A. and San Fran are basically tent dwellers. But in Seattle there's an upscale flavor, with more than a few doing the RV thing.

I made two trips to Seattle in the late 1980's. It was a very neat place to visit and had very little of the crises they face now with homelessness, crime and the fetid stench of Antifa.

These are all crises of their own making and human nature being what it is, the dive is deep. They all have similar sanitation issues, though. Via HotAir.com:
Using Environmental Protection Agency wastewater pump-out and treatment statistics, it’s estimated that Seattle RV campers likely discharge more than 1 million gallons of untreated sewage annually into our waterways, including the Duwamish Waterway and Salmon Bay…

To better understand the potential impact of RV discharges, the Sodo Business Improvement Area and Ballard Alliance commissioned Anchor QEA, a Seattle-based environmental science and engineering firm, to evaluate existing water-quality data and collect a storm drain water sample from a heavily populated RV parking area in Sodo. The sample from the storm drain in the midst of the RVs registered 300 times greater than the state water-quality standard for fecal coliform bacteria…

While a more definitive pollution-identification study is needed on the relative impact of illegal black-water discharges, the data points strongly suggest that illegal dumping of sewage and trash, along with unsanitary conditions in unregulated RV encampments, increase public-health risks and could result in serious outbreaks of communicable diseases such as hepatitis A and typhus.
Here on the Gulf Coast, people tend to get animated when a few thousand gallons of partially treated effluent is spilled accidentally. Those accidental flows are almost always (1) a result of very heavy rainfalls, (2) result in self-reporting by the parties responsible, (3) lead to universal media coverage by local news outlets.

That million gallons yearly in Seattle is in addition to whatever accidental spills may occur. In a city the size of Seattle, with rainfall patterns close to ours... the scale of pollution must be breathtaking (pun intended).

Station KOMO did an hour-long special (embedded below) on the overall homeless problem. If you watch the whole thing, prepare to come away shocked.


This is why we just can't let the Left export this disease to the east. I could spend a whole bunch of blogspace on the economics of homelessness, but the short takeaway would be that there's a supply crunch. Same thing with healthcare (but that has demand issues, too). Limiting supply is a sure way of driving up the cost of anything. Healthcare and housing are both under attack, though this only focuses on housing.

People out west are forced to choose housing over healthcare and/or  transportation and many end up losing both. The result is RVzuela in Seattle and  Tentezuela in L.A., because the left thinks more government control is needed when it is government control that's causing it all. Madness.

Thank God we still have some small sense of sanity here in happily Red Alabama. Let's keep the standard of living cheap here with lower taxes, fewer regulations and inexpensive housing.

Thursday, October 10, 2019

The U.S. Economy has never been better


If your chief concern is how the poor and middle class are doing in the Trump Economy, it's hard not to like the latest figures from the U.S. Census Bureau (PDF).

A few highlights from the report:
  • Real median family income rose 1.2% and real non-family median income rose 2.4%.
  • Real median wages and salaries (most important to lower income families) rose 3.4%.
  • Full-time gainfully employed labor rose 2.3 million.
  • The poverty rate dropped 4% and 1.2 million people left poverty.
  • In 2018, for the first time in 11 years, the official poverty rate was significantly lower than 2007, the year before the most recent recession.
  • Conditions improved for all Americans regardless of race, gender national origin or age.
Regardless of who you are or where you live in this country, you are better off today than you were this time in 2017 or 2016. 

A modest sum of $1,000 invested in October 2016 a 401(k) or IRA that tracks the growth of the S&P 500 Index is worth approximately $1,410 today. Financial markets are historically stable, historically healthy and are in a long term trend of gentle and healthy growth. Interest rates are historically low as well, meaning that families just starting out today face very good chances of securing a mortgage and owning a home (outside major metropolitan areas). 

Middle and lower income Americans still face a few challenges. An aging population and rising demand for medical services have healthcare costs rising faster than inflation. Unsecured/personal and student loan debt is uncomfortably high. But these are not insurmountable or panic-inducing problems for an economy growing healthily like this. 

You would think that good news like this would be major headlines. It's not, and Aaron Brown at Real Clear Markets talks about this, too.
However, 2018 worked for everyone. The economy did well, all the real measures of economic well-being were improved, and the Gini coefficient went down. More money, more equality. But you wouldn’t know it from the headlines.

· Ben Holland wrote at Bloomberg under the headline, “Census Says U.S. Income Inequality Grew ‘Significantly’ in 2018” and suggested the culprit was, “the impact of President Donald Trump’s end-2017 tax bill, which was reckoned by many economists to be skewed in favor of the wealthy.”

· Business Insider’s take was “US income inequality jumps to highest level ever recorded” , and quoted Professor Timothy Smeeding, "Wages remain low, there is a lack of childcare for single-parent families, and so on."

· Mike Schneider’s AP headline was “Census: US inequality grew”.

These are just three examples, the sentiments were echoed in many other news outlets, and chewed over by many opinion columnists. How did people get things so wrong? I can’t explain overlooking all the good news in the report except perhaps by the old newspaper adage, “If it bleeds, it leads,” meaning bad news sells more papers (or collects more clicks) than good. Or perhaps reporting good economic news would be considered support for Trump and might reduce enthusiasm for anti-poverty spending.
Brown goes into some detail on the Gini Index, which is a heavily cooked statistical distribution that attempts to measure how wealth is distributed within a country. It was developed in 1912 by Italian demographer, statistician and sociologist Corrado Gini (1884-1965).

Today's Gini Index is 0.486, which fell a three thousandths of a point from 0.489. In the U.S. the number has risen about 0.14 points since 1979. Since 1998, it has risen about 0.08.

The Gini Index has its uses in getting a big picture view of how poor people fare vis-a-vis the wealthy. An index reading of zero is the leftist utopia of perfect distribution of wealth. An index of 1.0 is perfect inequality, which is where the left thinks we are today. A relatively stable Gini indicates less economic uncertainty and less turmoil. A wildly fluctuating Gini indicates broad uncertainty and unrest.

A key takeaway from using Gini to gauge economic well-being is that it is independent of total economic wealth and output. A very wealthy nation with a high Gini number would likely see everyone living comfortably. A very poor nation with a low Gini would likely mean nobody has anything.

A slowly rising Gini Index has been a long time favorite tool of the left, and they've used it for decades in arguing for more spending to combat poverty and income inequality. Never mind that total wealth has grown faster over the same period. Never mind the glacial pace of its rise. That it's rising at all is cause for action!

But the drop in the Gini Index confounded them, so they chose arbitrary starting and ending points to cover up the fact that things are pretty good and getting better. Hence the headlines Brown lists above. 

Another key takeaway about the Gini Index is that its father was a fascist. He was a celebrated friend of Italian Dictator Benito Mussolini and a professed eugenicist. It was his intent to use his Index to measure the economic performance of genetically managed populations over time and to compare the performance of a pure race to the populations of less desirable or mongrel nations. He fervently supported Fascist Italy and Nazi Germany. How's that for irony?

Saturday, November 3, 2018

If Republicans hold the house in the 2018 midterms, thank the country folks

I want post this now, while all of my readers are watching college football. That way, if I’m right I’ll get to say, “I predicted it!” And if I’m wrong, all y’all can point at me and laugh at the data nerd.

Ok…

I just finished reading a fascinating analysis of the 2016 election, authored by a couple of data geeks. Sean Trende and David Byler are analysts at Real Clear Politics, a must-read-daily website full of charts, projections and analysis. Their analysis following the 2016 election looks at trends in the electorate over time with a geographic filter, breaking voters into six distinct groups: rural, small town, large town, small city, big city and mega city.

Here’s a tell-all chart presented in the conclusions section of the report:

This shows that over the last three decades, Democrats have dramatically increased their share of voters in the largest cities and  dramatically lost their share in areas that are large town or smaller. Their worst losses are in the smallest population areas. Democrats may be getting more votes nationwide, but concentrating those votes in cities that they already dominated is like shooting a dead man. It’s a wasted bullet because dead is still… well… dead.

Getting an extra four or five million votes across the cities of Chicago, Los Angeles, New York and Philadelphia is not enough to offset votes lost by the collective tens of millions from the thousands of Anytown, USA locales. There are at least 38 states that do not have a mega city in them or nearby. There are at least 25 that don’t even have a large city in them. Yet these “fly over” states have well over half of the eligible voters.

Democrats have created a very effective coalition of voters, but they have concentrated them in too few places, blunting their effectiveness and allowing Republicans to win elections without winning the majority of the popular vote.

This is important: You don’t need to win a national majority to win a national election.

California has a population of about 40 million. It has 53 members of the U.S. House of Representatives, or about one member for each 755,000 people. Alabama has about 4.9 million people and seven House members, or one member for every 700,000 people. Fewer people in Alabama have the same influence as a larger number of Californians. It’s not hard to put together a coalition of rural-ish states with fewer people wielding greater influence than states with high concentrations of urban dwellers.

This effect plays out in electoral politics but it also plays out in popular culture.

Pop culture is driven by urban dwellers. Urban areas are where the studios, producers, financiers, technicians and pop stars live because urban areas tend to have the physical infrastructure to support mass media production.

Urban areas are also more diverse demographically. They have higher concentrations of people of African, Hispanic and Asian descent. They also have higher concentrations of those identifying as having a non-traditional sexual orientation. As you watch your favorite commercial television programming over the next season, pay attention to the ads for alcohol, automobiles, toothpaste, mortgage lending and healthcare services. The vast majority of those will show the kinds and mixes of people you are likely to encounter in everyday life in the big city. Why? Because the people who make commercials use urban-ish people.

This may puzzle the Anytown citizen and for reasons he or she doesn’t realize. The small town banker may not run into a biracial or homosexual couple seeking a mortgage.  The rural grocer may not see a large south Asian family shopping together in her store. The large town teacher rarely has the child adopted by the gay couple in his class.

This cultural divide causes issues when the votes are counted on (and sometimes for weeks after) election day. The urban dweller can’t believe that their House or Senate candidate lost because all of the people just like them voted the same way. The rural-ish folks don’t see what the fuss is about, because all of the people just like them voted the same way.

The Ruralites may not (yet) understand the power that they wield, especially in midterm elections when turnout is typically low. But the Urbanites really don’t understand because everything they see on TV, hear on radio or dig on Spotify says everyone is diverse like them and diversity is just another word for Democrat.

They don’t understand that despite the diversity surrounding them in their urban enclaves, non-Hispanic whites still make up at least two-thirds of the electorate and most of that electorate lives in areas that are large town and smaller areas.

As a result, Urbanites are likely to conclude that the Ruralites are racist homophobes.

They would be wrong. Ruralites probably get the Melting Pot concept much better than Urbanites are willing to give them credit for. Most rural folks can trace their lineage back to immigrants, especially those in the rural areas east of the Mississippi and in the Mississippi River Watershed. Latin cultural influences are felt from rural Michigan to Louisiana and from south Florida to Wisconsin. The difference between those roots and the ones forming today is that in the ‘old days,’ immigrants assimilated and became Americans, contributing their culture to the greater American tapestry. This is less so with today’s Hispanic, Asian and growing Middle Eastern communities. Assimilation is now slower to occur, especially given the speed at which we get news today. Also, we have not helped assimilation by printing instructions for Life in America in languages not named English.

This frustrates Ruralites, who grew up speaking only English and maybe had bilingual grandparents. It’s not racist for immigrant-born Ruralites to expect today’s immigrants to do what everyone before them had to do. This is what made America great, they think, and when someone comes along with a promise to Make America Great Again, Ruralites are more willing to give the guy a shot.

The pollsters and election gurus missed the Ruralite movement in 2016, and may be missing it again in 2018.

Most of the 2018 polling, projections and analysis still look to the so-called ‘generic ballot’ as the most influential predictor in the outcome of congressional elections. This is a useful indicator of national sentiment, but it is still just an indicator of how the popular vote may go. It does not predict how people will vote. Even if it did, it ignores the first fact from above—you don’t have to win the popular vote to win a national election.

Two models: If both are right, Republicans will hold both the House and Senate

Ray Fair is a Yale Economics professor. He uses a numerical model driven by economic conditions to predict election outcomes and has a pretty good record—his was the only model that favored the Republicans in both the 2014 midterms and the 2016 election. The Fair Model predicts that Democrats will win 50.70% share of the vote.

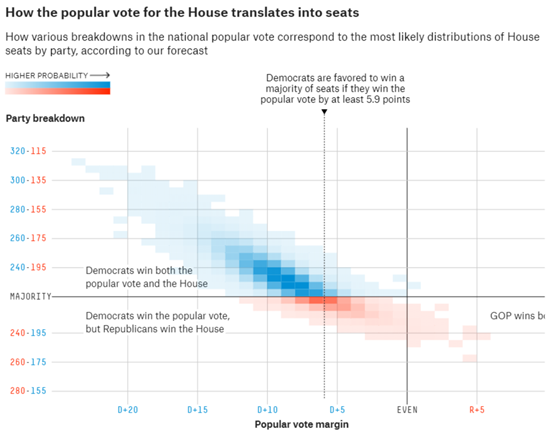
Nate Silver is the architect of the Five Thirty Eight prediction model. Silver currently gives the Democrats an 85.9% chance of taking the House (and an almost nonexistent chance of taking the Senate). However, this prediction is based on Democrats winning by at least 5.9 percentage points.

image


Fair's model says Democrats only get 0.70 points, just barely a majority. As we know from Trende and Byler’s analysis, and as we can see from Silver’s model, this means that Republicans are poised to surprise the talking heads in the media on Tuesday night.

I believe they will.

Tuesday, February 11, 2014

Dude… is it 1929 all over again?

History has a way of repeating itself, as the common wisdom goes. If that old adage holds up, you’d better hold on.

There are eerie parallels between the stock market’s recent behavior and how it behaved right before the 1929 crash.

That at least is the conclusion reached by a frightening chart that has been making the rounds on Wall Street. The chart superimposes the market’s recent performance on top of a plot of its gyrations in 1928 and 1929.

The picture isn’t pretty. And it’s not as easy as you might think to wriggle out from underneath the bearish significance of this chart.

clip_image001

Before you stock up on gold, guns and ammunition in preparation for a coming Great Depression Part Deux, there are a few things to keep in mind.

One is that contrary to popular belief, the 1929 stock market crash didn’t cause the Great Depression. That economic calamity was caused by a myriad of factors—an economic perfect storm, if you will. There were growing problems in the agricultural sector that drastically cut production in the heartland of the US. There was a failure by monetary policy authorities in the Fed to understand that liquidity is the mother’s milk of financial stability. In a 1963 landmark book by Milton Friedman and Anna Schwartz, the authors make a case that the Fed caused a rapid and catastrophic contraction in the money supply. Accepted economic principles state that as the money supply grows or shrinks, so do commodity prices and the value of capital. Kill the money supply, kill the economy. Explode the money supply, explode the economy.

Second, there are a number of structural and institutional controls in place now to prevent the sudden evaporation of calm and confidence that together slaughtered financial markets in 1929. Trading rules are exquisitely better defined now, such that a runaway collapse on the NYSE and NASDAQ are automatically halted before they begin (that’s an oversimplification, but I’m trying not to bore you).

Three is the fact that the Fed now takes seriously its role as the “lender of last resort,” which you saw in play during the financial crisis of 2008-09. The Fed will keep the spigot on in any crisis that might manifest itself in 2014, just as it did in 2008.

But don’t breathe a sigh of relief just yet. From 2009 through June of last year, the Fed began a program known as quantitative easing, in which it purchased trillions in the short term obligations of financial institutions. Those institutions used the cash to invest in capital markets as well as extending loans to businesses and individuals at historically low real interest rates. Stocks recovered steadily, despite anemic growth in the broad economy. In June 2013, the Fed started tapering off on the policy, reducing the flow of money through the system and causing a nearly 700 point drop in the Dow. Chairman Ben Bernanke then decided to slow the pullback of the easing policy, but it restarted a few months later.

This is similar to what happened with the money supply in 1928-29, which could be why there is such a scary correlation between Wall Street in 1929 and Wall Street in 2014. Remember: kill the money supply, kill the economy.

In short, there’s no sustainable way to continuously pump money into the economy. Although the Fed can create money out of thin air, at some point, a massively easy credit policy can only do so much. There also has to be a responsible fiscal policy that allows the private sector to grow and recover the traction it had before the crisis began.

What’s your hope for a responsible fiscal policy with this administration?

Monday, November 29, 2010

Liberals to propose paths to a lower deficit: What could possibly go wrong?

Via the New York Times. Liberal groups have their own ideas about how to reduce the deficit.

Great idea, right?


WASHINGTON — As President Obama’s fiscal commission faces a deadline this week for agreement on a plan to shrink the mounting national debt, liberal organizations will unveil debt-reduction proposals of their own in the next two days, seeking to sway the debate in favor of fewer reductions in domestic spending, more cuts in the military and higher taxes for the wealthy.

The proposals from two sets of liberal advocacy groups highlight the deep ideological divides surrounding efforts to deal with the nation’s budgetary imbalances, even as Mr. Obama’s bipartisan commission works to finalize its recommendations by Wednesday — and struggles for a formula that would get the backing of at least 14 of its 18 members, the threshold for sending its proposal to Congress for a vote.


image Oh, the metaphors.

You have a convicted felon whose only real passion is stealing cars.  So, let’s have him come up with new and innovative ways of obtaining a nice new ride.

You have a known Ponzi scheme conspiracist whose only real passion is bilking elderly investors. So, let’s have him come up with new and innovative ways of protecting senior citizens from fraudsters.

You have a mortgage banker known for constructing complicated derivative securities that take down banks and paralyze financial markets. So, let’s have her come up with ways of protecting markets from meltdowns.

Let alcoholics decide who gets booze and spoiled fat children decide who gets the candy.

Seriously entertaining any ideas about deficit reduction from liberals is like seriously entertaining retirement planning suggestions from Dr. Kevorkian. Nothing good will come of it.

Fortunately, we have a solid conservative majority in the House of Representatives, who will likely be joined by an ever dwindling group of Blue Dogs to quash any such notions.  Had this been floated in November 2009, we would be horrified.

Friday, November 5, 2010

Finally: Decent news on the unemployment front

Before departing on an expensive, 12-day trip to Asia, El Presidente trumpeted today’s release of the Bureau of Labor Statistics’ Employment Situation Summary.  He noted the 159,000 increase in private sector payrolls, but skipped over the fact that the unemployment rate is stuck at 9.6%, basically where it’s been since spring:


Nonfarm payroll employment increased by 151,000 in October, and theunemployment rate was unchanged at 9.6 percent, the U.S. Bureau ofLabor Statistics reported today. Since December 2009, nonfarm payrollemployment has risen by 874,000.

Household Survey Data

The number of unemployed persons, at 14.8 million, was little changedin October. The unemployment rate remained at 9.6 percent and hasbeen essentially unchanged since May. (See table A-1.)

Among the major worker groups, the unemployment rate for adult men(9.7 percent), adult women (8.1 percent), teenagers (27.1 percent),whites (8.8 percent), blacks (15.7 percent), and Hispanics (12.6 per-cent) showed little change in October. The jobless rate for Asians was 7.1 percent, not seasonally adjusted.

The number of long-term unemployed (those jobless for 27 weeks andover) was about unchanged over the month at 6.2 million. In October,41.8 percent of unemployed persons had been jobless for 27 weeks ormore. (See table A-12.)

Both the civilian labor force participation rate, at 64.5 percent, andthe employment-population ratio, at 58.3 percent, edged down over themonth.


Population growth adds about 100,000 working age adults to the labor force each month.  However, continued advancement in technology and worker productivity means that the economy needs to add 125,000 new jobs to maintain pace with population, given the same level of output. In other words, month-to-month, it takes 125,000 new jobs to reduce unemployment, even though only 100,000 new job seekers enter the marketplace due to advancing technology, shifts in productivity and emigration of some jobs.

October is only the second month in 2010 that non-farm payrolls exceeded that number, and the margin of 34,000 is not much.  It would take the better part of a decade to work down the existing “labor inventory” of jobs lost since Obama and the 111th Congress took office. So, while today’s release was good news, the overall performance of Democrats on the economy, as told by the unemployment picture—is dismal.

Friday, October 29, 2010

GDP grew 2.0% in 3rd quarter, Federal spending up 8.8%

In the last piece of major economic news to be released before the crucial 2010 midterm elections, the Bureau of Economic Analysis says that the US economy grew at the glacial pace of 2.0% in the quarter between July 1 and September 30:


Real gross domestic product -- the output of goods and services produced by labor and propertylocated in the United States -- increased at an annual rate of 2.0 percent in the third quarter of 2010,(that is, from the second quarter to the third quarter), according to the "advance" estimate released bythe Bureau of Economic Analysis. In the second quarter, real GDP increased 1.7 percent.

The Bureau emphasized that the third-quarter advance estimate released today is based on source data that are incomplete or subject to further revision by the source agency (see the box on page 3).The "second" estimate for the third quarter, based on more complete data, will be released on November 23, 2010.

The increase in real GDP in the third quarter primarily reflected positive contributions frompersonal consumption expenditures (PCE), private inventory investment, nonresidential fixedinvestment, federal government spending, and exports that were partly offset by a negative contributionfrom residential fixed investment. Imports, which are a subtraction in the calculation of GDP, increased.

The small acceleration in real GDP in the third quarter primarily reflected a sharp deceleration inimports and accelerations in private inventory investment and in PCE that were partly offset by adownturn in residential fixed investment and decelerations in nonresidential fixed investment and inexports.

Real federal government consumption expenditures and gross investment increased 8.8 percentin the third quarter, compared with an increase of 9.1 percent in the second. National defense increased8.5 percent, compared with an increase of 7.4 percent. Nondefense increased 9.6 percent, comparedwith an increase of 12.8 percent. Real state and local government consumption expenditures and gross investment decreased 0.2 percent, in contrast to an increase of 0.6 percent.

Real nonresidential fixed investment increased 9.7 percent in the third quarter, compared with anincrease of 17.2 percent in the second. Nonresidential structures increased 3.9 percent, in contrast to adecrease of 0.5 percent. Equipment and software increased 12.0 percent, compared with an increase of24.8 percent. Real residential fixed investment decreased 29.1 percent, in contrast to an increase of 25.7percent.


Though the 2.0% figure is mostly in line with analyst estimates, it still indicates that the economy is not growing robustly enough to stimulate job creation or change the Fed’s mind about the need for quantitative easing—a monetary policy move that risks inflation and further erodes the dollar in foreign exchange markets.

Two key pieces of data in today’s release:

Residential investment, one of the best leading indicators of expected growth, fell by an eye-popping 29% and federal expenditures increased by nearly 9%.  This means that government spending is the primary reason for the GDP growth.  The private sector is still struggling and is not likely to liven up anytime soon.  Meanwhile, the federal government continues to spend at nearly a double-digit pace, using money that must be borrowed and increasing the federal debt.

This pace is absolutely unsustainable.

Thursday, October 28, 2010

Weekly jobless claims take another dip, down 21,000

Fresh data from the Bureau of Labor Statistics Website:


In the week ending Oct. 23, the advance figure for seasonally adjusted initial claims was 434,000, a decrease of 21,000 from the previous week's revised figure of 455,000. The 4-week moving average was 453,250, a decrease of 5,500 from the previous week's revised average of 458,750.

The advance seasonally adjusted insured unemployment rate was 3.5 percent for the week ending Oct. 16, a decrease of 0.1 percentage point from the prior week's revised rate of 3.6 percent.

The advance number for seasonally adjusted insured unemployment during the week ending Oct. 16 was 4,356,000, a decrease of 122,000 from the preceding week's revised level of 4,478,000. The 4-week moving average was 4,447,250, a decrease of 38,500 from the preceding week's revised average of 4,485,750.


These are the last weekly claims figures to be released prior to next week’s midterm election.  New applications for unemployment compensation have been stuck in a range between 450,000 and 475,000 for months, now.

Half of last week’s decrease of 23,000 new claims was accounted for by an upward revision in the previous week’s data and the moving average remains stubbornly stuck above 450,000.

While there is nothing particularly rosy or damaging in this week’s data, it still highlights a very weak job market and an economy struggling to keep its head above water.  We should get confirmation of the sluggish economy with tomorrow’s estimate of Q3 GDP growth.  Analysts expect something on the order of 1.5% to 2.0% annual growth.

It’s in this setting that voters will go to polls next week and issue a referendum on the efficacy of President Obama’s economic policies.

Wednesday, October 20, 2010

Employment Report: Alabama is getting back to work

The Bureau of Labor Statistics is out with a year-over-year report, showing changes in unemployment rates for the nation’s 372 metropolitan statistical areas (MSA’s).  The report covers the period from August 2009 (or about the time that NBER says the recession ended) through August 2010.  Some areas fared pretty well.  Others, not so much.

Alabama comes out looking very good:


The Florence-Muscle Shoals area in Northern Alabama saw a drop of 2.3 percent making it the second largest drop in the nation. Decatur was fifth. Anniston and Gadsden shared the eighth spot and Tuscaloosa was number ten.

Mobile and Montgomery are among the top 50, with a 1.2 percent drop in unemployment over the last 12 months. Overall, Alabama’s unemployment rate declined by 1.4 percent.

“Alabama right now is leading the nation when it comes to reducing unemployment,” said Governor Riley.

“No other state has seen a bigger drop in its jobless rate over the past year, and of the 10 American cities that have seen the largest declines in unemployment, five of the top 10 are in our state. It’s certainly a positive sign that Alabama is headed in the right direction.”


Alabama has a very pro business environment, and it’s just easier to do business in this state versus those it’s competed against for recent large capital investment projects, including the multi-billion Thyssen Krupp steel plant, the Raytheon Missile Plant and the Hyundai expansion.  All of the state’s MSA’s posted year-over-year gains.

Other areas of the country continue to suffer, though.  Of the 372 MSA’s, 182 posted gains, so about half broke even or worse. Those that posted unemployment rate increases totaled 169.  Of the ten MSA’s with the worst year-to-year figures, eight of them are out west.  The worst?  Yuma, AZ with a net increase in unemployment from 25.9% to 30.2%.  Ouch.

Thursday, October 14, 2010

Weekly Jobless Claims take another dip, down 23,000

Fresh data from the Bureau of Labor Statistics Website:


In the week ending Oct. 23, the advance figure for seasonally adjusted initial claims was 434,000, a decrease of 21,000 from the previous week's revised figure of 455,000. The 4-week moving average was 453,250, a decrease of 5,500 from the previous week's revised average of 458,750.

The advance seasonally adjusted insured unemployment rate was 3.5 percent for the week ending Oct. 16, a decrease of 0.1 percentage point from the prior week's revised rate of 3.6 percent.

The advance number for seasonally adjusted insured unemployment during the week ending Oct. 16 was 4,356,000, a decrease of 122,000 from the preceding week's revised level of 4,478,000. The 4-week moving average was 4,447,250, a decrease of 38,500 from the preceding week's revised average of 4,485,750.


These are the last weekly claims figures to be released prior to next week’s midterm election.  New applications for unemployment compensation have been stuck in a range between 450,000 and 475,000 for months, now.

Half of last week’s decrease of 23,000 new claims was accounted for by an upward revision in the previous week’s data and the moving average remains stubbornly stuck above 450,000.

While there is nothing particularly rosy or damaging in this week’s data, it still highlights a very weak job market and an economy struggling to keep its head above water.  We should get confirmation of the sluggish economy with tomorrow’s estimate of Q3 GDP growth.  Analysts expect something on the order of 1.5% to 2.0% annual growth.

It’s in this setting that voters will go to polls next week and issue a referendum on the efficacy of President Obama’s economic policies.

Friday, October 8, 2010

US Unemployment Rate still at 9.6%, Payrolls plummet 95,000

Fresh from the Bureau of Labor Statistics website at www.bls.gov:


Nonfarm payroll employment “edged” down (-95,000) in September, and the unemployment rate was unchanged at 9.6 percent, the U.S. Bureau of Labor Statistics reported today. Government employment declined (-159,000), reflecting both a drop in the number of temporary jobs for Census 2010 and job losses in local government. Private-sector payroll employment continued to trend up modestly (+64,000).

Household Survey Data

The number of unemployed persons, at 14.8 million, was essentially unchanged in September, and the unemployment rate held at 9.6 percent.


These are the last unemployment and payroll figures to be released before the November 2, 2010 mid-term elections.

Gory numbers like this are not good news for Democrats.  The US unemployment rate hasn’t been below 9.5% since January, 2009—the month Obama took office. Incumbents now have to go home and campaign in Districts and States, and explain why nearly $1 billion in “stimulus” spending did virtually nothing to curb persistent joblessness and an economy struggling to stay above water.

I was looking for the unemployment rate to increase to 9.7%.  I’ll go through some of the tables and post an update later today.

Separately yesterday, the Gallup organization released its own independent survey of households and employment.  It’s findings? Equally dismal:


Unemployment, as measured by Gallup without seasonal adjustment, increased to 10.1% in September — up sharply from 9.3% in August and 8.9% in July. Much of this increase came during the second half of the month — the unemployment rate was 9.4% in mid-September — and therefore is unlikely to be picked up in the government’s unemployment report on Friday. …

The government’s final unemployment report before the midterm elections is based on job market conditions around mid-September. Gallup’s modeling of the unemployment rate is consistent with Tuesday’s ADP report of a decline of 39,000 private-sector jobs, and indicates that the government’s national unemployment rate in September will be in the 9.6% to 9.8% range. This is based on Gallup’s mid-September measurements and the continuing decline Gallup is seeing in the U.S. workforce during 2010.


Update:  Calculated Risk does its typically excellent job charting the data and showing the real picture of how the economy is struggling.  I’m borrowing the small chart here.  Follow the link to see the big picture of how this wreckovery is unlike any other in post-WWII history.

image

Thursday, October 7, 2010

Weekly jobless claims take another slight dip

Fresh from the Bureau of Labor Statistics Website:


In the week ending Oct. 2, the advance figure for seasonally adjusted initial claims was 445,000, a decrease of 11,000 from the previous week's revised figure of 456,000. The 4-week moving average was 455,750, a decrease of 3,000 from the previous week's revised average of 458,750.

The advance seasonally adjusted insured unemployment rate was 3.5 percent for the week ending Sept. 25, a decrease of 0.1 percentage point from the prior week's revised rate of 3.6 percent.

The advance number for seasonally adjusted insured unemployment during the week ending Sept. 25 was 4,462,000, a decrease of 48,000 from the preceding week's revised level of 4,510,000. The 4-week moving average was 4,510,750, a decrease of 27,750 from the preceding week's revised average of 4,538,500.


The fact that it’s a positive number is its only positive feature.  If we were really recovering, we would see much larger decreases in weekly jobless claims.

Tomorrow morning, we’ll get the last clear pre-election snapshot of the employment picture with the release of September payroll data, non-farm employment and the unemployment rate.

Yesterday’s release of ADP’s National Employment Report indicated weakness, but the Department of Labor has a much larger reach in terms of sample size and survey depth.  As Ed Morrissey of Hot Air points out, the ADP number is more of a directional signpost than it is a determinative or predictive indicator.

And, as discussed at Calculated Risk, the 39,000 loss was far, far below forecaster estimates, so the signpost is clearly pointing down.

Today’s weekly jobless claims data indicates that the figures we get tomorrow probably won’t be as bad as the ADP report suggests.  The weekly figures have been stubbornly hanging around a 4-week moving average of about 440,000 to 450,000 for the entire month of September.

At any rate, only a stellar increase of 100,000+ new non-farm payrolls and a 0.1 to 0.2% decrease in the unemployment rate will give Democrats something to go home and talk about.  There is nothing in any of the data we’ve seen for September to indicate that’s going to happen.

The labor market remains stubbornly weak and should stay that way through the calendar year.

Wednesday, October 6, 2010

ADP National Employment Report shows slowing economy

ADP has released its analysis for the month of September, and the news is not good.  Consensus forecasts were for anywhere from a zero gain to a slight increase (around 10,000), which economists believe would be cancelled out by the release of temporary Census workers.

  Instead:


Private-sector employment decreased by 39,000 from August to September on a seasonally adjusted basis, according to the latest ADP National Employment Report® released today. The estimated change of employment from July to August was revised up from the previously reported decline of 10,000 to an increase of 10,000.

The decline in private employment in September confirms a pause in the economic recovery already evident in other data. A deceleration of employment occurred in all the major sectors shown in The ADP Report and for all sizes of payroll. The September decline in employment followed seven monthly increases from February through August. However, over those seven months, the average monthly gain in employment was 34,000. There simply is no momentum in employment.

Unlike the estimate of total establishment employment to be released on Friday by the Bureau of Labor Statistics (BLS), today’s ADP National Employment Report does not include the effects of federal hiring — and now firing — for the 2010 Census. Hiring for the census peaked in May and is still tapering down slightly.


This means that if the Census did indeed lay off the several thousands expected, then Friday’s Bureau of Labor Statistics report could be very bad news.  If private sector employers didn’t add jobs in September—and the ADP figures indicate that they didn’t—then expect the Friday figures to be “unexpected.”

Whether or not ADP’s figures presage the flavor of Friday’s BLS report, the data clearly show that the economy is not gaining strength and will struggle to stay above zero net growth in Q4 2010 and Q1 2011.  Q4 is the strongest quarter of the year for retail sales, and if people are concerned about job security and employment prospects, a dismal holiday shopping season is in store.

ADP is a company that handles payroll management for companies across the United States. 

Saturday, October 2, 2010

Two important October economic releases could seal the fate of Democrats

image Two key releases of economic data are coming in the next few weeks, and they could turn a pending electoral disaster into a catastrophic tsunami for Democrats.  On Friday, October 8, the Bureau of Labor Statistics releases the monthly payrolls and unemployment picture.  The consensus forecast is a net-zero gain (meaning private sector payroll gains will cancel out losses from Census temporaries) to a net-negative of around 10,000.  The unemployment rate is expected to rise slightly to 9.7% but a decrease in the participation rate (already at a morbidly low 64%) could put enough downward pressure for the rate to stay at 9.6%.  A decrease in the unemployment rate is highly unlikely—last month’s report had an unrounded estimate of 9.643%.  More likely is that the unrounded rate moves up by the few hundredths of a point needed to round to 9.7%.

On Friday October 29, the Bureau of Economic Analysis releases the preliminary estimate of Third Quarter GDP growth.  The consensus is for a number similar to the Q2 estimate of about 1.7% to about 2.0%.  A US economy growing less than a 2.5% annualized rate is too sluggish to create enough jobs to keep up with population growth and we head into the biggest quarter of the year for retail sales.

These are the last two major indicators of economic health to be released before the November 2, 2010 mid-term elections, and they can only hurt Democrats, not help them.  Having the numbers beat consensus estimates by a wide margin—meaning that economic forecasters badly blew their estimates—would be a too little, too late proposition for the party in power.  The clock has long been ticking on energizing a voting base, and the Republicans are way ahead on that scorecard.  Conversely, having the numbers come in significantly below consensus estimates—again meaning that economists badly blew their forecasts—would be a hammer blow. 

But if the two indicators show up in line with consensus forecasts, it means voters go to the polls with the fresh taste of Democrat fail in their mouths.  The narrative from Monday, November 1 to Tuesday, November 2 will go something like this:


”With the latest economic figures showing the Democrats’ ambitious plan to rejuvenate a sagging economy has failed to gain real traction after two years in power, voters head to the polls on Tuesday in a referendum on President Barack Obama’s policies.

“Fresh polling shows Republicans are likely to win back the House of Representatives and make a serious run at taking the Senate, and this comes amid a backdrop of stubbornly high unemployment, sluggish economic growth, depressed housing prices and sagging retail sales.”


Friday, October 1, 2010

Bureau of Economic Analysis: Personal Income and Expenditures post weak gains

Fresh from the BEA Website:


Personal income increased $59.3 billion, or 0.5 percent, and disposable personal income (DPI)increased $52.0 billion, or 0.5 percent, in August, according to the Bureau of Economic Analysis.Personal consumption expenditures (PCE) increased $41.3 billion, or 0.4 percent. In July,personal income increased $22.0 billion, or 0.2 percent, DPI increased $5.7 billion, or less than 0.1 percent, and PCE increased $41.4 billion, or 0.4 percent, based on revised estimates.

Real disposable income increased 0.2 percent in August, in contrast to a decrease of 0.2percent in July. Real PCE increased 0.2 percent, the same increase as in July.


Although these figures came in slightly higher (or in line with) analyst expectations of around 0.4% and 0.3% for income and expenditures, the growth rate is still very tepid.

Calculated Risk, an economics blog, points out that the data shows expenditure growth in Q3 will probably be around 2.0% - barring a significant change in September, and that this suggests sluggish GDP growth in Q3.

It’s worth noting that consumer spending drives anywhere from two-thirds to three-fourths of US economic output as measured by GDP. A 1.5% to 2.0% rate of growth in real (after inflation) GDP is insufficient to produce enough jobs to keep pace with population growth.

So yes, Ms. Velma Hart.  This is the new reality.  At least for a while.

Monday, September 27, 2010

Unemployment may increase even WITH growth

It’s a creeping malaise caused by stagnant to slightly positive growth in economic output accompanied by sluggish hiring in the labor market.  It’s a long, painful economic illness, it is always and everywhere the product of leftist economic ideology, and it’s probably already here.

In today’s Wall Street Journal Online edition:


The strong likelihood of tepid economic growth through next year suggests unemployment may rise, rather than fall, as many forecasters currently predict.

In a paper published Monday, economists at the Federal Reserve Bank of San Francisco warn business cycle analysis generated within the central bank system is pointing to growth that will be “at or below potential” growth levels.

This modest rate of advancement won’t be enough to generate the needed level of job growth, which suggests “the unemployment rate could rise by as much a 0.5 percentage point during this period,” moving from the current level of 9.6% to 10.1%. The paper’s authors, economists David Lang and Kevin Lansing, observe “such a scenario would take the unemployment rate back to the peak recorded in October 2009.”


In a post late last week, I explained some of the reasoning behind such a sluggish labor market.  It’s primarily a climate of uncertainty that kills confidence and makes businesses think twice about expanding production and adding new employees.  On the other side of the labor market is supply.  Depending on which economic forecasts you read, the economy needs to add between 150,000 and 225,000 new jobs every month just to keep up with population growth.  If the economy is growing at a rate too slow to support that level of job creation, the unemployment rate rises as new people enter the job market.

This has two effects that are felt right away:  It suppresses wages because there are more people competing for fewer jobs (thus driving the price of labor down), and it creates even more uncertainty by consumers.  Consumer spending drives nearly 70% of the economic output of the U.S.  If consumers have less money to spend because of falling wages, aggregate demand is reduced, which drives down the prices of goods and services produced.

It’s a classic economic catch 22 in that consumers spending less translates into businesses hiring less, further depressing consumer confidence and spending.

So how do you get out of the spiral?

Improve business confidence.  Make it easier and less expensive to do business in the U.S., and American businesses will do what they do best.  There are many ways to improve business confidence:  Getting rid of Obamacare is one way.  De-clawing the immense federal regulatory environment is another.  But the best way to improve the business climate is to send a certain message to the business community: Cut corporate income taxes, eliminate capital gains taxes altogether and stop this stupid class war distinction between the people who create the jobs and the people who work in them.  There is no better relationship on the planet than there is between productive employee and successful small business owner.  The former is always handsomely rewarded for his efforts to improve the latter’s business success, because the latter knows that productive employee is just as good at a competitor’s place of business.